


|
|


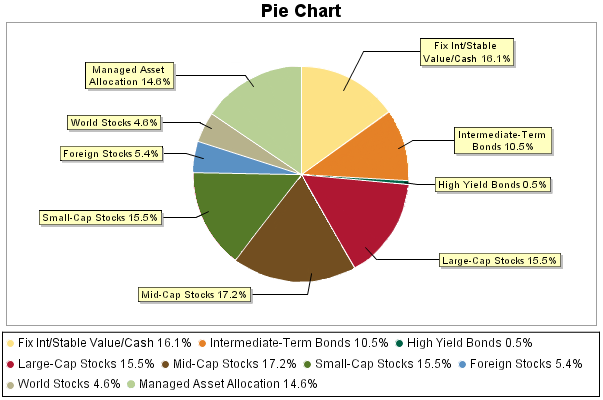
A pie chart displaying the investment allocation of assets is provided as long as no more than thirty-two investment options have a balance.
View more information about the investment option summaries.
Account Detail as of
| Investment Option Name (Internal ID) | Investment Type | Units | Percent 1 | Value |
|---|---|---|---|---|
| AUL Fixed Account (FIXD) | Fixed Int/Stable Val | 931,416.5754 | 16.1 % | $947,189.60 |
| Total Fixed Interest/Cash | 16.1 % | $947,189.60 | ||
| Intermediate-Term Bonds |
||||
| PIMCO Total Return (PTRR) | Int Term Bond | 540,970.5655 | 10.5 % | $617,605.00 |
| Total Intermediate-Term Bonds | 10.5 % | $617,605.00 | ||
| High Yield Bonds |
||||
| Amer Fds Ameri High Inc Trst (AFHI) | High Yield Bond | 2,194.7846 | 0.5 % | $29,674.74 |
| Total High Yield Bonds | 0.5 % | $29,674.74 | ||
| Large-Cap Stocks |
||||
| AmCent Equity Income (AEIA) | Large Cap Value | 333,591.4968 | 8.8 % | $517,032.12 |
| T Rowe Price Growth Stock (TLCG) | Large Cap Growth | 237,288.9916 | 6.7 % | $393,573.22 |
| Total Large-Cap Stocks | 15.5 % | $910,605.34 | ||
| Mid-Cap Stocks |
||||
| Goldman Sachs Mid Value (GSML) | Mid Cap Value | 478,156.8394 | 7.4 % | $435,763.94 |
| Fidelity Adb LevCo Stk (FALT) | Mid Cap Blend | 303,368.1084 | 6.4 % | $372,511.16 |
| Thornburg Core Growth (TBCG) | Mid Cap Growth | 117,107.5435 | 3.4 % | $200,993.31 |
| Total Mid-Cap Stocks | 17.2 % | $1,009,268.41 | ||
| Small-Cap Stocks |
||||
| Fidelity Adv Small Cap (HASC) | Small Cap Growth | 515,597.4085 | 15.5 % | $910,041.80 |
| Total Small-Cap Stocks | 15.5 % | $910,041.80 | ||
| Foreign Stocks |
||||
| Thornburg International Value (TINV) | Foreign Blend | 109,405.4386 | 5.4 % | $318,520.81 |
| Total Foreign Stocks | 5.4 % | $318,520.81 | ||
| World Stocks |
||||
| Invesco Global Equity (AGTR) | World Stock | 225,406.0059 | 4.6 % | $267,206.88 |
| Total World Stocks | 4.6 % | $267,206.88 | ||
| Managed Asset
Allocation |
||||
| Russell LifePoints® 2010 Strat (RS10) | Mgd Asset Allocation | 58,334.8677 | 1.1 % | $62,024.14 |
| Russell LifePoints® 2020 Strat (RS20) | Mgd Asset Allocation | 54,668.3807 | 1 % | $61,299.38 |
| Russell LifePoints® 2030 Strat (RS30) | Mgd Asset Allocation | 549,878.1602 | 11 % | $642,638.76 |
| Russell LifePoints® 2040 Strat (RS40) | Mgd Asset Allocation | 76,155.6012 | 1.5 % | $89,829.71 |
| Total Managed Asset Allocation | 14.6 % | $855,791.99 | ||
| Total Account Value | 100 % | $5,865,904.57 | ||
| Outstanding Loan Balance(s) | $5,000.00 | |||
| PLAN VALUE | $5,870,904.57 |
 |
